In-game content is important, but for many roguelike players there’s a lot of fun to be had outside the game as well, be it reviewing records of one’s own runs, getting good insights into runs by other players, or relying on data to learn more about the game and engage in theorycrafting.
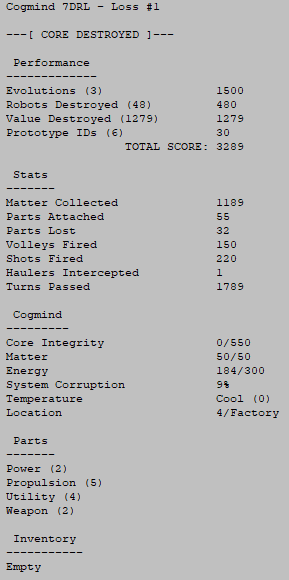
Back in 2015 I explored morgue files in various roguelikes and wrote about a potential future for Cogmind’s own so-called “scoresheets.” The original intent of these files, added for the 7DRL in 2012, was simply to report the player’s score for each run and give a few very basic stats. It was a 7DRL , after all, and there wasn’t a bunch of time for heavy record keeping.
In the days after 7DRL I wanted to run a tournament and thought it’d be fun to hand out achievements, but to do that we’d need more stats to base them on. Being outside the 7-day restriction I was free to spend some time on that and the “Stats” section got a few dozen more entries. You can see what the scoresheet became in those days in this example from Aoi, one of only two players known to have ever won the 7DRL version (the high scores, with links to scoresheets and tournament achievements, can be found here).
In the years since, aside from occasionally adding new sections to the file, the primary Stats section simply grew longer and longer as I tacked on entries for new mechanics and content, growing from 79 in the 7DRL (2012) to 328 in Alpha 1 (2015) to 818 in Beta 8 (2019)!
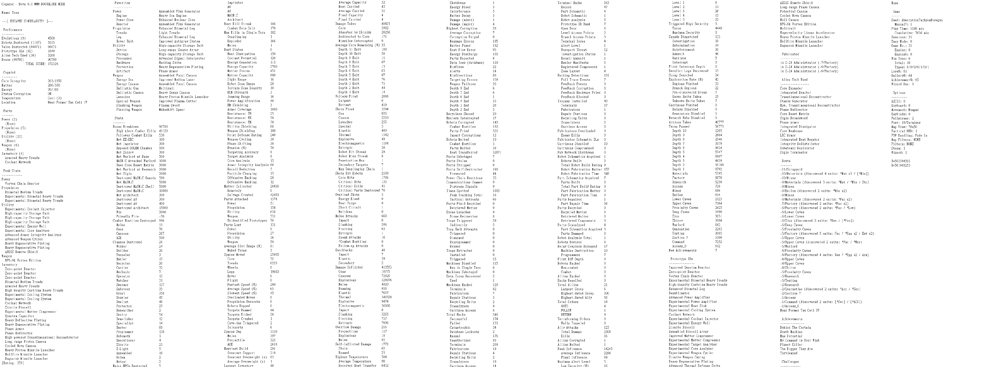
A Cogmind scoresheet from a sample Beta 8 run by Tone, which I’ve restructured horizontally because the full length is 24 pages! I’ve also shrunk the image down to avoid spoilers while retaining the general idea of its breadth, however if you don’t mind spoilers (this particular win spoils a lot!), you can check out this same run in its text form here. Note the full potential length of a scoresheet is technically even longer than this--many stats are not shown unless they’re relevant to the run, omitting them either to speed up parsing or to avoid spoilers, so this sheet for example is missing about 100 entries xD
- The format was at least pretty simple, and if there any significant changes to its content I’d already have to put a bunch of time into rewriting the analysis code (used to produce the leaderboards and aggregate metrics), and that code was a mess and all going to be replaced one day for the final system anyway.
- Some players had built useful third-party applications based on the scoresheet format, so too many changes in the interim could break these unnecessarily.
- As usual, it’s best to wait on designing systems that touch a lot of other features until most all those potential features are in place, so that the supersystem’s design can take everything into account.
With Cogmind approaching 1.0 now, a lot of the content and systems are already in place, plus we have a lot more experience with run data and what people want to know about their/others’ runs, so it’s finally time to bite the bullet and build Scoresheet 2.0!
Preparation
To prepare for the transition to the new scoresheet, I finally exported all the existing score data parameters to an external text file. The original scoresheet data being as limited as it was, from 2012 it simply lived inside the code as a bunch of separate arrays. It was messy, and I never cleaned it all up simply because I knew that one day it would all be replaced anyway, so may as well wait until that day in order to do it right the first time. This allowed me to merge quite a few arrays and multiple disparate bits of data storage into a single text file with contents represented by a single data structure.
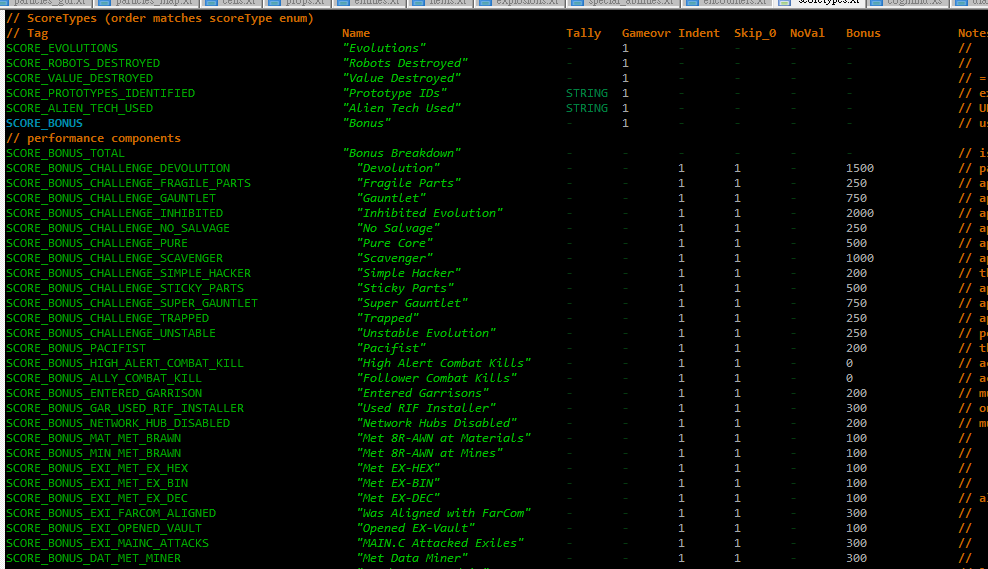
A snapshot of Cogmind’s scoreType data, a new 897-line file where all the score/stats entries and their behavior are controlled.
Even just this first step made the whole system feel sooooo much better. Moving data out of the code makes it much easier to maintain, and less prone to errors.
The next question was how the new data would be stored, but that couldn’t be answered without a clear idea of everything that would go into the new scoresheet…
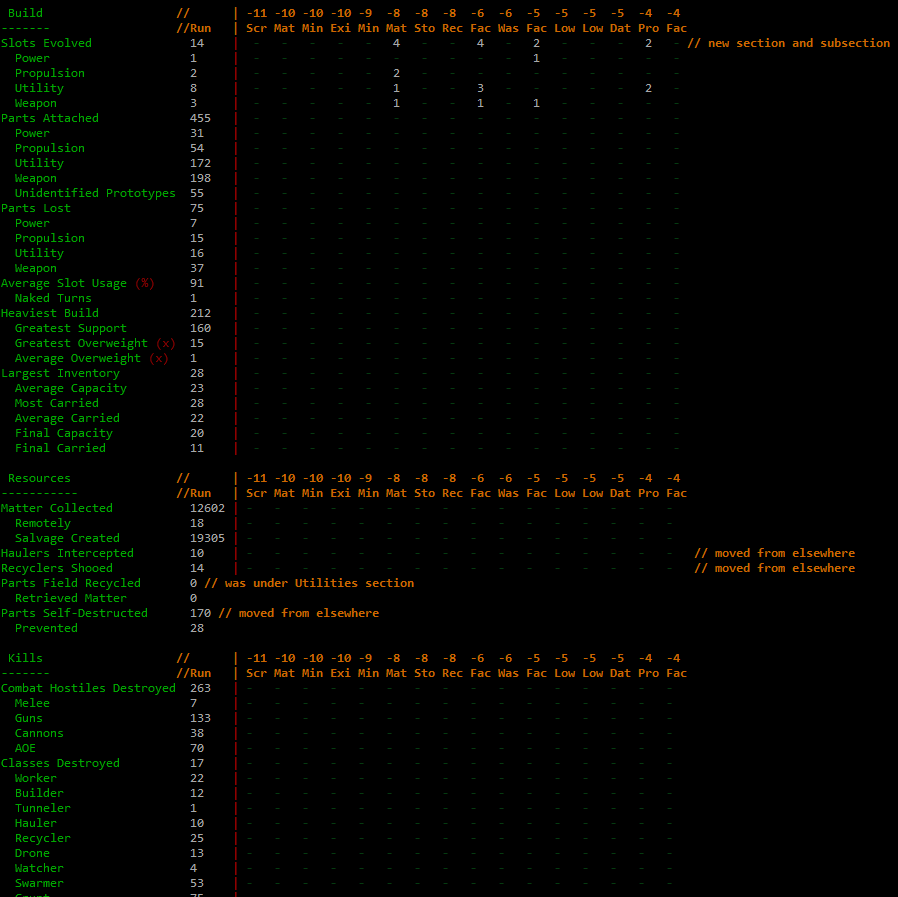
Aside from organizational concerns, and new content, the most significant aspect of Scoresheet 2.0 would be its recording of stats on a per-map basis. Scoresheets historically just had a single value per entry*, and it was clear we wanted more values in order to paint a better picture of how a run progressed, but at first I wasn’t sure just how many values to store--once per depth for some values? Once per depth for all values? Once per map for… everything?!
(*There were just a few important stats already recorded once per depth--remaining core integrity, for example--but these would be rendered obsolete by an even more detailed per-map system.)
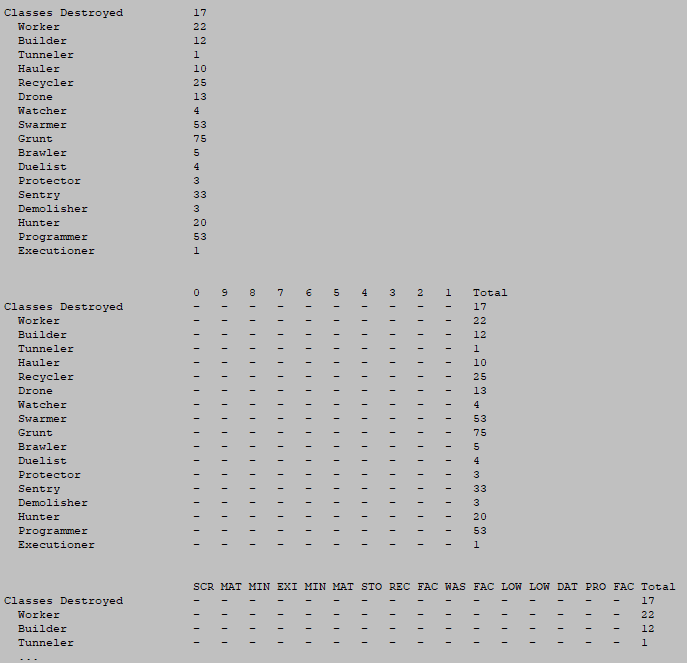
At this point I did a couple tests, the first a layout mockup to compare the aesthetics of per-depth and per-map values, just to get my head in that space.
As you’ll see later, I decided the total should remain at the beginning to ensure all those values line up (since they are the most commonly referenced, after all), a separator line was necessary between the total and per-map areas (for easier parsing), and along with the map abbreviations it would be important to indicate their depth as part of the headers as well.
I also calculated out the text file size for such a scoresheet, to ensure it would be within reason given the number of stats we’re talking about here. Upwards of 800 stats recorded across 30 maps, for example (a higher-end estimate for longer runs), is 24,000 entries! Not to mention the composite run-wise values and all the other data included in scoresheets (lists, logs, and more). The result is definitely larger compared to Beta 8 scoresheets (around 10~25KB each), but a majority of these newer scoresheets should still fall within 100KB. Based on real tests by players so far, this seems to generally hold true, although the longest runs visiting over 30 maps will fall between 100~150KB.
If necessary to keep the number of values down, I was considering having only a portion of the stats do per-map recording, but eventually decided to instead go for consistency and keep the full set, especially since I could envision times when almost any given value might want to be known on a per-map basis. There are just a few stats for which per-map values would make no sense and therefore be confusing, so those are excluded.
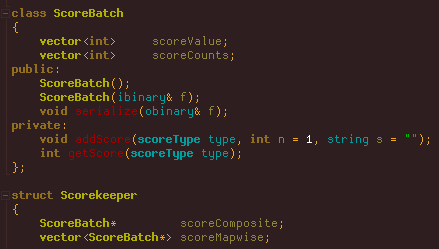
On the technical side, to make the transition easier I simply had the existing “Scorekeeper” class change its behavior on receiving a new score value. Whereas before it would just merge values with a single list as necessary, now it has multiple sets of score values (a “batch”): The composite batch is each stat’s value for the entire run, while the map-wise batches store a separate complete set of stats for each map. So for example when the player destroys a target, that event is recorded in both the composite batch and the batch for the current map.
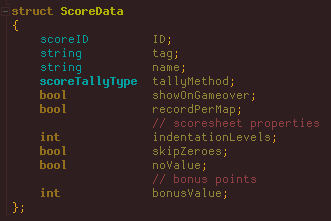
While we’re in the source, below is the data structure storing all static values defining each scoreType found in the external file mentioned earlier.
There are six different tally methods to choose from, with the vast majority of scoreTypes belonging to the default “additive” category, though a few require special alternatives:
- HIGHEST: Takes the highest between the stored and new value.
- LOWEST: Takes the lowest between the stored and new value.
- STRING: New value only included if a string provided with it is unique to this stat (for example only wanting to record once for each unique object).
- AVERAGE: Takes the average of all values.
- AVERAGE>0: As AVERAGE, but ignores any zeroes.
Mockup
There would be a lot of rearranging data to come, all amidst adding new entries, so to make sure I got it right the first time, I needed a clear and complete goal to work towards. Thus in addition to the large collection of related notes I’d already accumulated, I also took an old-format scoresheet and modified that to create the target format, in the process taking yet more notes as I thought through the requirements, feasibility, and repercussions of each change. That mockup would serve as the initial blueprint to simply implement top to bottom, step by step.
You can download the full text mockup with annotations here. I used a winning run uploaded by Amphouse as the basis for this mockup because I wanted it to contain a wide variety of stats, though that also means it originally contained more spoilers--most of that stuff was edited out so I could share it here. Note that while the per-map data formatting gives you an idea of what it could look like, many of the numbers are either made up or outright missing.
Later there were also some small changes to the format as well as yet more sections/content I hadn’t foreseen to include in the mockup, but I saved that original version for posterity (it also includes some of my notes and reasoning about parts I hadn’t settled on yet). We’ll get into the final form next :)
Organization
For the remainder of this post I’ll be showing image excerpts from sample scoresheets to demonstrate various sections, but if you want to also follow along with the full text version of a complete Beta 9 scoresheet, you can download this recent run by Ape. There will likely be a few tweaks here and there before Beta 9 is officially released (it’s still in prerelease testing), but for the most part this is representative of the final format. (Remember a number of stats are not visible because they weren’t triggered for this particular run, so it’s technically not a complete set, nor is any individual run, for that matter.)
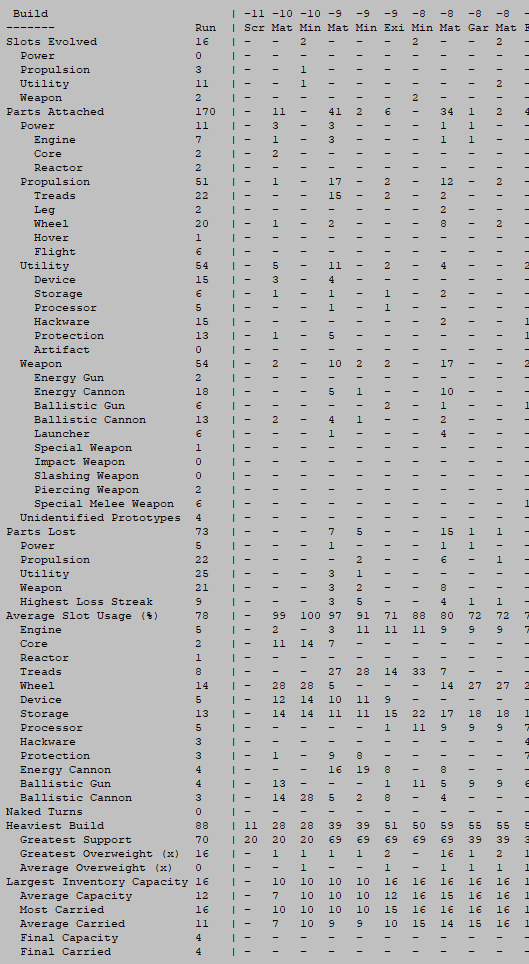
One of the obvious improvements over the original “endlessly expanding version” is that it’s now much better organized. Alongside the preexisting “non-stat” categories like Parts, Peak State, and Favorites, the core stats list itself has been broken down into 15 categories and reorganized as necessary to match them. We now have separate sections for Build, Resources, Kills, Combat, Alert, Stealth, Traps, Machines, Hacking, Bothacking, Allies, Intel, Exploration, Actions, and Best States! Categorization makes it easier to both find and understand relevant data. Plus it looks cooler :D
One thing I didn’t add to the scoresheet is a list of every part attached, or even every build at the end of each map. There’s just no great way to do these, and compared to the amount of space it would occupy this information would be difficult to parse, anyway. In hindsight I discovered the new automated class system will work nicely for that purpose, and that in itself also occupies two new sections in the scoresheet I’ll talk about later.
“Per-weapon damage” and other details discussed by the community before in the context of an expanded scoresheet is another of the few things that were left out for similar reasons. I thought of somehow combining it with the Favorites section, but alone this information doesn’t seem as valuable as it would be in comparison with all weapons used. We already have shots fired by weapon category, as well as damage tallied by type, both of which combine with per-map data to provide a clear yet concise picture of weapon use.
Sub-subcategories
Stats can now make use of a second level of indentation.
Previously scoresheets could only contain primary stats and sub-stats, but that led to a handful of problematic situations where (mainly because stat names are kept from being too long) some stats really needed to be indicated as a subcategory to an existing subcategory and were therefore prefixed with ‘^’, which is a bit esoteric :P. The new system fixes that by allowing more indentation. I’m not going overboard with it, but it is needed or advantageous in a few situations so I expanded the use of sub-sub-stats a bit.
Header
At the top of the scoresheet are a few lines serving as the general header where you’d naturally put the run’s vital info, even if that info appears elsewhere.
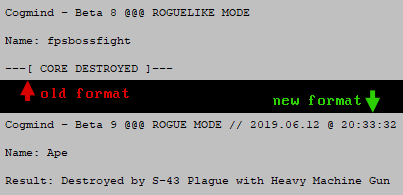
This includes the name of the game and its version, as well as whether it was a win or loss. If you look back to the 7DRL scoresheet example, you’ll see that the header remained relatively unchanged through the years (aside from adding a player name, which couldn’t be specified back in the 7DRL).
Scoresheet 2.0 adds extra detail, most importantly the cause of death!
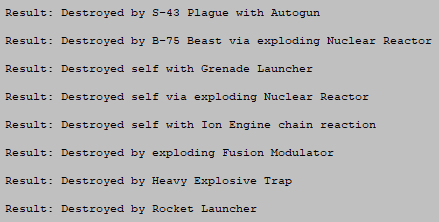
The result can of course show a win, in which case as usual it will state the type of win, but many roguelike runs end in a loss, and although it’s fairly common in roguelikes to record the cause of death, this isn’t something Cogmind was equipped to do before.
For six years now, internally the game only got as close as recording a general cause of death, for example “by cannon,” or “by cave-in,” and this was not really worth including in the scoresheet because it’s clearly an incomplete system that can’t account for all possibilities, and also needs more detail to be as meaningful as possible.
So while we’re vastly improving the scoresheet, it’s about time to include this information! (Also imagine the fun aggregate data we can collect :D) This took a fair bit of work to both identify all the possibilities and variations and store the necessary information when it’s available to provide it for the final conclusion. The sentence needs to take into account the relevant actor (Cogmind? enemies? no one?), kills via proxy, death to non-robot/attack causes… all sorts of stuff. Here are some more examples:
Some players have indicated they’d like to be able to remain on the main UI after death to get a better idea of the situation, but this is at odds with Cogmind’s immersive approach so I decided not to. There are alternatives like examining a log export afterward, or now using the scoresheet to see the specific cause of death, and/or last log messages, and/or surrounding environment (these I’ll get to further below).
Going back to the header format changes, see how it also now includes the date and time of the run’s end, but without the more compressed YYMMHH-HHMMSS time format used in the filename.
Scoresheets for special modes or events will also be listed next to the primary difficulty mode, if applicable. Those always used to only be recorded elsewhere in the scoresheet, if at all.
The difficulty modes and their names are changing as well, but that’s a topic for a whole other article! Update 190917: Said article has now been published, Rebranding Difficulty Modes with an eye towards player psychology.
Performance
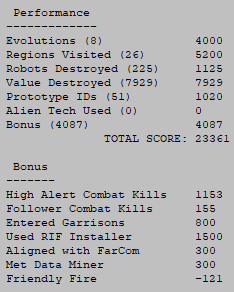
The score structure hasn’t changed much. Throughout alpha/beta I’ve been watching and waiting to see if an all-around better approach to scoring would suggest itself, but didn’t come up with anything, so the existing system will remain.
It has, however, been expanded slightly with the addition of Regions Visited. Rewarding exploration is a good way to encourage it, so a set amount of points are earned for reaching each new map. In the early years points for “Evolutions” served that purpose well enough, earned at each new depth, but back then the world was narrower, whereas players can now spend up to a half or even three quarters of a run inside branches, exploring horizontally. While it’s true there are also bonus points to earn in branches, not everyone may actually earn those anyway, and it’s worth recognizing that they still made the trip.
The bonus point system will continue to be an important source of points for most runs, but it’s flexible and can be adjusted/expanded more in the future as necessary. Notice that I moved that breakdown right up under the Performance section.
There were no changes to Parts, Peak State, or Favorites, which all still serve their purpose just fine.
Stats
There have been quite a few improvements and new entries added to the stats section (which, again, have been divided into 15 categories). I won’t cover all of them, but will talk about certain areas of particular interest…
Build
Much of this section is new, adding a breakdown of all slot evolutions, as well as info on subtypes for attached parts and slot usage. Combined with the per-map data, we’ll be able to have a pretty clear picture of how builds evolved across the run as a whole, in a much more condensed and readable format than if we had list after list of build loadouts or some other highly detailed approach.
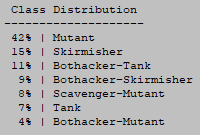
Instead, after the detailed data we get a list of the most popular build classifications used throughout the run, ordered by usage. The list excludes any used for less than 4% of a run, as there could be many such transitionary states that aren’t really meaningful in the bigger picture.
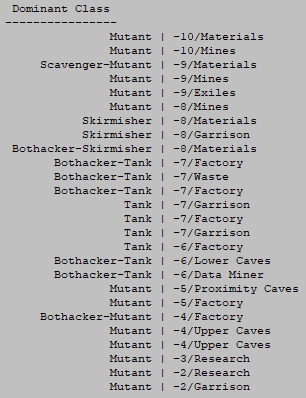
Following the aggregate class distribution is a summary of the player’s dominant build classification for each map. Where multiple build classes were used, which is common, it picks the one that saw the longest period of use.
Automated build classifications are a new system I’ll be diving into later in a separate article in this series. It’ll be fun to run data analysis on the future scoresheets to learn what builds are more popular, a very new way to understand the player base.
Kills
With scoresheet 2.0 we finally get kill counts for more specific robot types! To simplify the code, this system had always relied on Cogmind’s internal robot class system, which is essentially what you saw appearing on this list before. The problem is, the game has grown so much since then and you can now eventually meet some rather special special variants that shouldn’t really be tallied along with the others--like not-your-everyday Grunts and Programmers, but there was no way for the system to distinguish them, meaning some of the most powerful hostiles in the game were being lumped with the average ones. No more! Now we’ll finally be able to see real kill counts for all of the special robots out there…
The “NPCs Destroyed” list also now includes all uniques (as well as where they were killed!), so yes that means we’ll also have a record of the nefarious exploits of those out there murdering bots who should otherwise be powerful allies ;). This list always included the major NPCs, but over the years Cogmind has gained a cast of minor named NPCs as well, so it’s finally time to start seeing them in the data.
Hacking
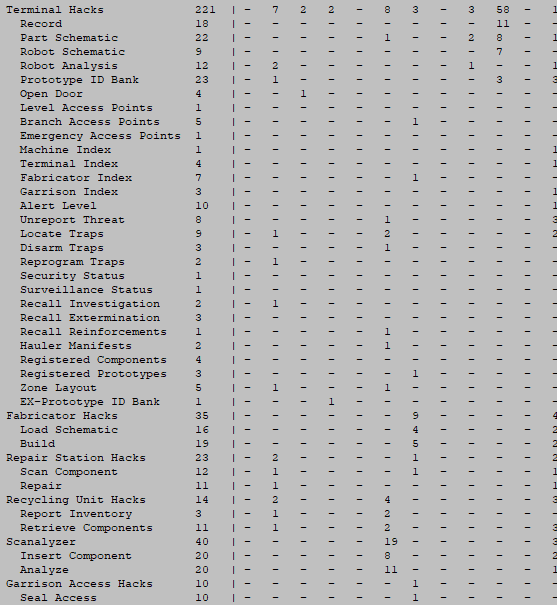
As of Beta 8 the scoresheet only records Terminal hacks, but that’s been greatly expanded to include every possible hack--all machines and even unauthorized hacks, too.
Remember here that a lot of entries don’t actually show unless they’re non-zero, so there are quite a few more possible data points than what you see in the sample run, hacking and otherwise.
Actions
I can see some interesting analysis coming out of looking at a breakdown of actions across a run. It’s a pretty fundamental kind of data, but was actually rather challenging to implement because Cogmind didn’t originally need to distinguish between action types in such a granular way. Anyway, we have it now :D
History and Map
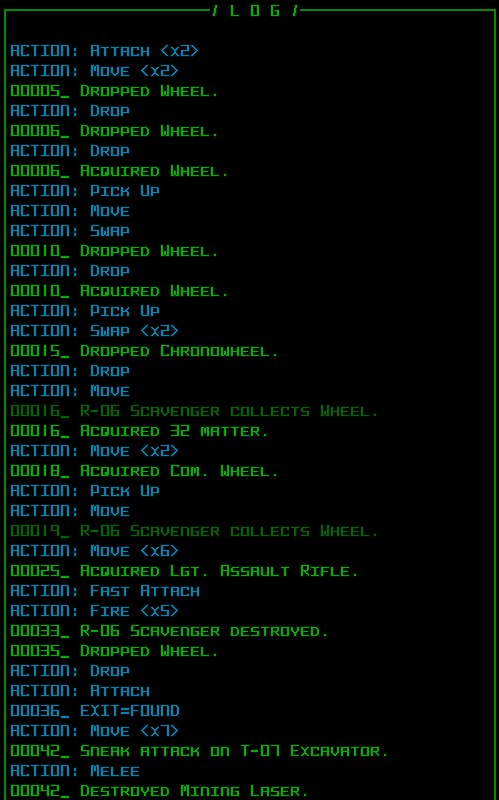
It’s common in roguelikes for a morgue file to include the last X messages from the message log, and while I don’t think this section will be quite as valuable or interesting in Cogmind as they are there (due to de-emphasis of the log in general), it won’t really hurt to add it and could at least in some cases help describe what was happening just before The End, especially in combination with the map.
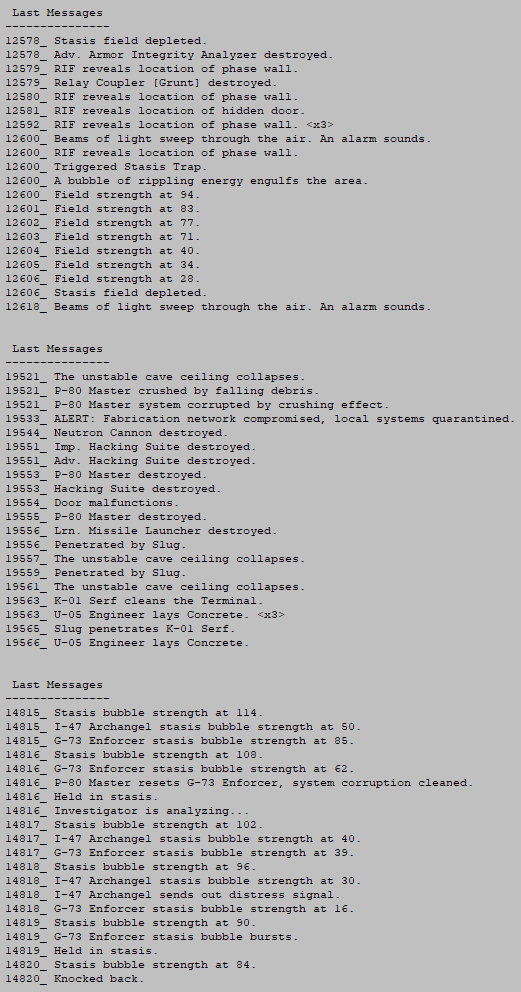
Sample scoresheet 2.0 excerpts: Last Messages from three separate runs. For Cogmind I’ve chosen to record the last 20 messages in the scoresheet.
However, the ASCII map and history log (different from the message log!) are quite valuable and I’ll be dedicating separate articles in this series to each of them.
Schematics and Fabrication
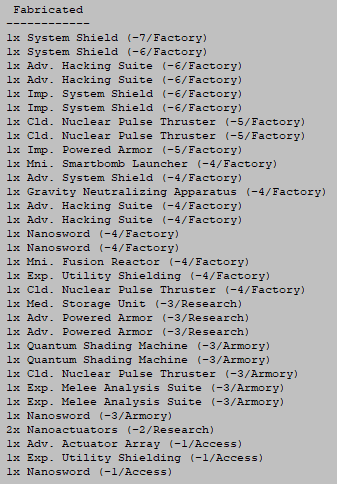
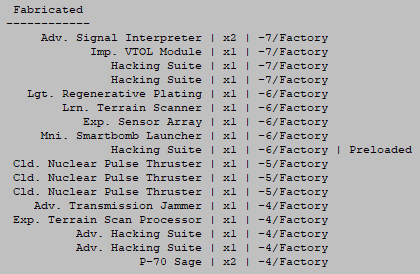
Since Alpha 9 the scoresheet has included a list of any parts fabricated during the run, and where they were built. But with literally every part of the scoresheet being revisited for 2.0, I discovered this one needed some improvements, too!
The content is mostly unchanged, but the same data can be presented in a much more easily readable fashion--alignment is important!
Due to their varying lengths, it’s far easier to scan a list of columns than with all the data mixed together. Content-wise the only addition is the new “Preloaded” marker indicating that a particular fabrication was completed using a schematic not loaded by the player themselves.
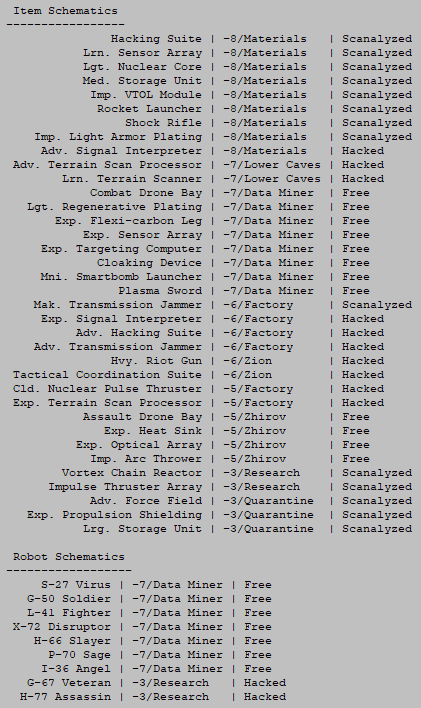
Item and robot schematics weren’t even recorded in the original scoresheet, but have been added for 2.0, also aligned in a pleasing and readable manner.
Often times players will obtain schematics but not actually use them, either due to lack of opportunity or deciding not to, but either way it’s interesting to see what schematics players are going after, and how they’re acquiring them since there are a number of different methods (including four more that don’t even appear in the above sample!).
Game and Options
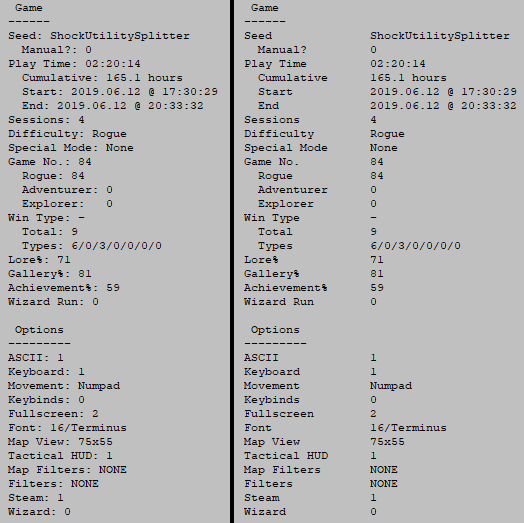
Another area that got the formatting treatment are the last two meta sections, Game and Options.
Years ago they were very short lists with just a few entries, and output using different code than regular stats, so they were never actually aligned and this didn’t seem too problematic early on. But now they collectively account for over two dozen entries and the difference between alignment and non-alignment is stark.
As shown in the header earlier, the date format has changed, now also recording the start time in addition to when the run ended. Originally only the latter was included, but in my research I noticed other roguelikes recording both and this seems like a good idea.
Run play time and cumulative play time both have new formats as well. These were originally shown in minutes, whereas the latter now uses the gaming “standard” of hours to a single decimal point (127.3 hours is much easier to understand than something like “7636 min” :P) and run time is shown using the HH:MM:SS format. Now real-time speed runs can care about the seconds as well ;)
This is the first article in a four-part Building the Ultimate Roguelike Morgue File series:
- Part 1: Stats and Organization
- Part 2: ASCII Maps
- Part 3: Mid-run Stat Dumps
- Part 4: History Logging
