Player metrics are an important resource for a game developer, providing valuable insight into player preferences, capabilities, strategies, and more. Data is also fun, so I’m here share it with you all :D
Cogmind features the ability to upload player statistics at the end of each run (opt-in only, of course, in case some players are opposed to the idea), giving players a passive way to contribute to development.
Certainly one of the best ways to learn how players interact with a game is to observe them playing it in person (or via streams/LPs), but those opportunities are more suited to examining interaction from a UX/learning perspective, while in-game metrics collection is the only practical approach to form a broader view of the player base. This view is steeped in quantitative detail, and scales nicely.
Having access to real data from players, as opposed to theoretical predictions relied upon during the earliest stages of development, enables developers to improve the game or at least make sure it’s working as intended. During early access this also has the benefit of informing future design and balance decisions.
Alpha Challenge 2015
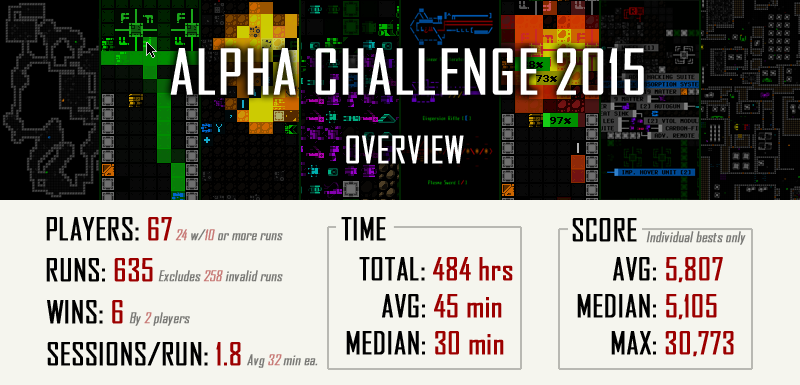
I’ve been collecting data for a few months since alpha launch, but until recently only used it to compile the leaderboards, being too busy to do anything else productive with it. Ever since launch it’s been my intention to hold a tournament for alpha supporters, so with a stable mostly mechanics-complete Alpha 3 behind us we finally did that this month, a two-week event which turned out great.
As an organized event (with prizes!) “Alpha Challenge 2015” was an effective way to stimulate participation and related discussion, as well as a good opportunity to write some code to analyze the wealth of data coming in. Overall it was a surprisingly large amount of work and I couldn’t make any progress on the game itself for the duration, but the resulting discussion and analysis is technically another important part of development!
You can see the full results of the tournament here, but the purpose of this post is to more broadly examine the heaps of data for what it can tell us about Cogmind and our players.
Caveats
Some points to note before going into our analysis:
- The data doesn’t include all runs (or even all players), only those that qualified for inclusion, defined as non-anonymous players who earned at least 500 points. Players automatically receive 500 points for ascending beyond the first depth (though it’s still possible to earn enough points before leaving that area). This eliminates from the pool 258 runs where the player was either destroyed before they did anything meaningful, or were perhaps start scumming or learning the game.
- Graphs depicting data by depth include only runs that ended at that depth, not historical data for runs that made it beyond that point (data which is unavailable). The effect slants the data in various ways, but the impact is not significant enough to undermine the usefulness of the results.
- The participation rate was 4.62% of the approximate 1,450 owners at the start of the event, which seems fairly good considering a lot of players bought to support the game but don’t intend to play until 1.0, or already tried it out a bit for fun but don’t intend to dive in until it’s complete to get the “full experience.” (And of course others also just happened to be busy during the event.) Still, conclusions drawn from this data are generally valid for describing the characteristics of the greater player base and how they would fare in the game, as in this group we clearly have a spectrum experienced and inexperienced players. A few players even bought during the Challenge and jumped right in; others repeatedly reached the late game to vie for the top 10 spots.
On to the data!
Preferences
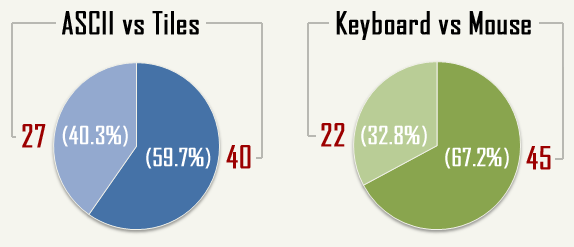
Taking a look at preferences is one good reason for getting as many players participating at once as possible. It’s also something I’ve been the most curious about, and now we have answers! Cogmind’s score sheet uploads mostly report gameplay metrics, but there’s a handful of other variables such as those enabling us to create the following graphs.
For its first 18 months of development (excluding 7DRL and the interim hiatus) Cogmind was purely ASCII, and its visual design is first and foremost aimed at the traditional roguelike community. So it’s no surprise that more than one-third of players forgo the tileset default in favor of the easily parseable, Matrix-hacking, alphabet-soup style.
That said, one of the goals with Cogmind is to attract fresh players to the genre, and even in alpha it’s succeeding in that goal by becoming the very first roguelike for some! Without tiles as a gateway this would be an elusive goal, even despite the game’s unique take on ASCII visuals. Certainly a larger portion of early access players are hardcore roguelike fans, which pumps up the ASCII numbers somewhat, so I expect the ASCII percentage to drop as the player base expands (it will be very interesting to look at this ratio again once Cogmind is on Steam). For comparison, according to the 2012 DCSS survey “only” 24% of players use ASCII in that game, plus 1) that was three years ago--DCSS’s popularity has since increased--and 2) it’s not on Steam.
The most interesting takeaway from the input graph, keyboard vs. mouse, is the rather significant number of keyboard users, again about one-third of the total and, again, like ASCII we can attribute this to a greater percentage of dedicated genre fans taking part in alpha access. “Mouse users” includes those who solely use the mouse, or a hybrid mouse-keyboard style to speed up some commands; “keyboard” is a special mode in which the mouse cannot be used, so it’s pretty clear cut who’s relying purely on the keyboard (the fastest way to play). As with tiles, a fully mouse-enabled interface is a vital accessibility feature needed to reach a broader audience.
We’ll take a closer look at ASCII and input preferences as part of the scores discussion further below.
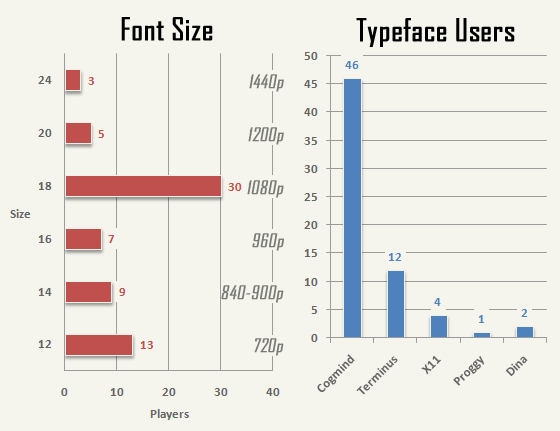
Font size is less of a preference than an incidental variable reflecting screen size, since a majority of players play in fullscreen mode which selects the largest possible font size that will fit. From this we can extrapolate the game resolution (not otherwise recorded) and compare their respective usage ratios to the values assumed prior to launch.
Last year while discussing fonts in roguelikes I wrote about common resolutions (direct link to relevant chart; see also the beginning of this post for a Cogmind-specific chart w/considerations), and we can now see that the predictions more or less hold true for Cogmind’s current players. The largest group of players (44.8%) use a 1080p (FHD) screen, followed by the second largest group (17.9%) using 720p (HD).
Regarding typeface, I’m pleased to learn that a significant majority of players (70.8%) prefer the original Cogmind typeface. To accommodate players who were having trouble reading it on today’s high-DPI monitors I did add dozens of alternative font options post-release, though while more readable those do lose the thematic appeal of the default typeface. Still, that’s 29.2% of players who would have been less happy without the new fonts.
Play Time
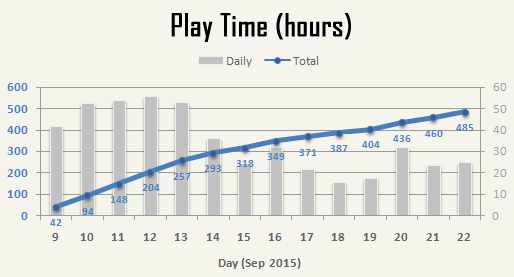
An average 32 minutes per session (or entire run for at least half of players) seemingly qualifies Cogmind as a coffee-break roguelike, but this wasn’t my aim to begin with. While the game is designed for epic scope, it does happen to be easy to pick up an earlier run in progress, as everything you need to know is displayed right on the HUD. Stopping a session mid-map isn’t advisable, in order to maintain general floor-wide situation awareness (especially if corrupted since you can lose map data), though new areas are frequent enough. Because these mostly wipe the slate clean, and you can’t travel backwards to previously visited areas, there are plenty of opportunities to pause a run at points that keep a low barrier to continuing later. There is also anecdotal evidence that late-game players were shortening sessions to 10-15 minutes each to avoid making mistakes =p, and others remarked that it was easy to pick up unfinished runs.
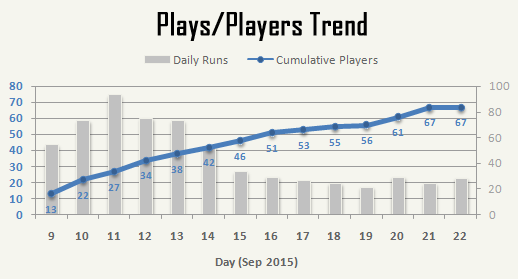
Throughout the event there was a fairly steady increase in new participants, playing anywhere from 20 to 75 runs each day. (For comparison, there are approximately 25 runs per day under normal circumstances--no event, no recent release.)
The majority of runs (71.5%) occurred during the first half (Sep. 9-15), and 35.8% of participants each played 10 or more games throughout the event. This latter group formed the majority of players still playing through the event’s latter half as they competed for achievements and the top 10.
Weekends (Sep. 12-13; Sep. 19-20) don’t seem to have had any meaningful impact on participation.
In all, 484.7 hours were played (again, this excludes nearly one-third of runs, those that didn’t make it beyond the first floor), with a trend that more or less reflects the previous graph. A few participants were playing a lot and making it quite far on some runs, which combined with the relatively small pool of players is enough to skew the data upward on some days.
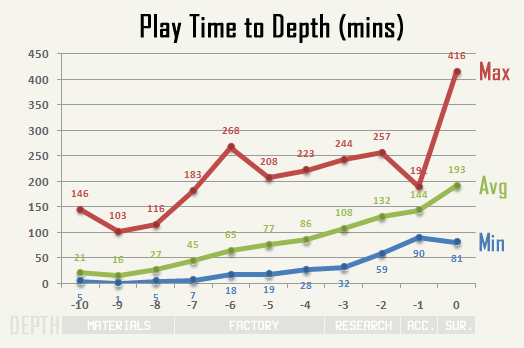
On average, it takes about half an hour to escape the “early game” (Materials), and about an hour and a half to reach the late game (Research). However, the duration of a run is largely impacted by strategy--where a given Cogmind lies on the stealth-combat spectrum. Stealth runs will be significantly faster, and are more closely represented by the Min line, while getting bogged down in combat and the rebuilding cycle will pull a run towards the Max line. Also notice that the average is much closer to Min than Max at all but one depth*, suggesting that either most of the Max values are outliers or more players were attempting stealth runs. (*Note: -1 has very few data points.)
Segment-specific observations:
- Materials: The seemingly unreasonable Max play time in these early floors actually represent a brand new player learning the game--probably a lot of reading going on.
- Factory: These numbers are not players still learning the game, but rather reflect the fact that Cogmind gets much harder here and maps are huge. It’s easy for beginners fresh from being able to conquer Materials to spend a lot of time wandering around the Factory engaging in the back and forth of combat, which becomes significantly more intense at this depth.
- Research: Regardless of player experience, it’s easy for anyone to spend a while searching for exits here, a fact supported by the sudden rise of our Min line.
- Surface: The huge range seen at depth 0 (victory!) exemplifies the difference potential between stealth and combat runs. Both the Min and Max here were achieved by one of our latest experts, zzxc, with a fastest speed win of 81 minutes (1867 turns*) and the highest-scoring combat victory that took 6.9 hours (28,485 turns*). (*The fastest builds can move 10 or more times in a single turn, while slow builds might move only once per two turns, or slower.) For reference, including wins outside the tournament stealth runs take anywhere from 3k-5k turns and last 80-120 minutes, while full combat runs take from 17k-28k turns and last 4-7 hours. Currently expert player Happylisk holds the record for fastest combat win in real time, at 4.2 hours.
Overall the average play time to each depth seems well balanced, gradually rising at a rate of 10-20 minutes per map (this again supports the earlier mention of coffee break convenience). We’ll see the time spent at each depth change with the addition of many more maps in future releases, though those are optional side routes so the choice is up to the player whether to branch out horizontally.
Score
Scores started out spread all over the place, with clearly experienced players making it to Research early on, intermediate ones to Factory, and beginners falling in Materials and the early branches.
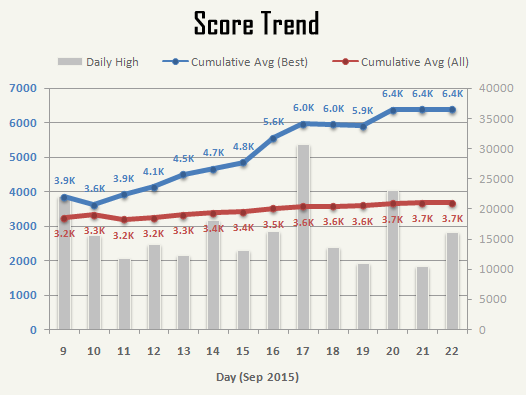
Change in the average score (cumulative over all previous scores), shown with the highest individual score for each day.
The average individual best scores (i.e. the values used to measure players against one another) increased 77.7% from their lowest point at the beginning of the event to the end. By comparison the average of all scores rose by only 15.6%, dragged upwards by players improving their skills even as new/less experienced players continued to join in the later days. At the same time that average had some downward drag in the form of high frequency players who hadn’t learned how to reliably exit the early floors and could still die in Materials despite being capable of performing okay in the mid-game. (Early and mid-game strategies can differ greatly so some players might be better at one than the other.)
Other observations:
- Both averages plateau for the last couple days because there were no significant personal bests added in that period.
- Close to two-thirds of players (59.7%) managed to at some point rise above the all-score average, a rather high percentage that reflects the greater luck factor involved in runs for players who have trouble reliably besting the mid-game. (They might come across some really nice parts, for example.)
- Looking at the daily highs, the tournament’s only two combat wins are apparent on 9/17 (zzxc) and 9/20 (Happylisk). Full combat wins are much more risky--and longer--than stealth wins and therefore score significantly higher. None of the tournament’s four stealth/speed wins even set a daily high.
Regarding wins, five players had won the game before the event, but only two competed so we didn’t end up with a lot of recorded wins, at least not by different players. Leader zzxc won five times (basically whenever he wanted to stealth run it =p); he’s also generously written a spoiler-filled guide about how to achieve such a victory here. In the week immediately following the Challenge we added three new stealth winners :).
As no players yet have complete knowledge of the game (those with more experience tend to specialize in certain areas), participants playing the most games naturally had a better opportunity to learn more and push up their best scores. You can see this below where the top half of players averaged 20 runs throughout the two-week Challenge:
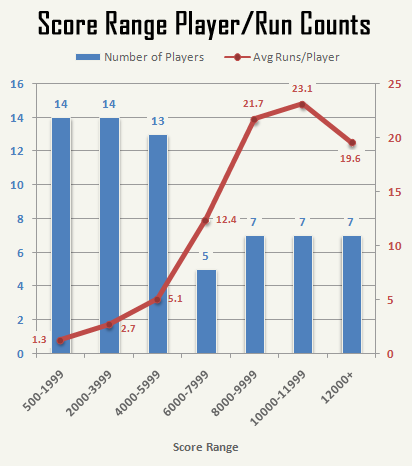
Number of participants with best scores falling within the indicated range, showing also the average number of runs by each participant in that category. (*Excludes non-qualifying runs.)
At the other end, many of the players with few runs originally joined alpha to support development, but haven’t yet gotten much into it while they wait for 1.0, participating this time around just to be a part of the event (and perhaps in some cases for a chance to win a random prize). This group of players averaged only 1-5 runs, most of them of shorter length.
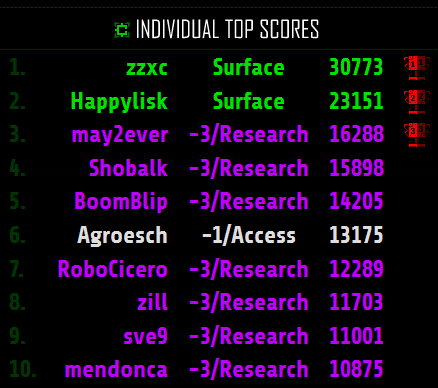
The final top 10 ended up being quite competitive, with many of the top participants repeatedly besting their own scores and leapfrogging up the board:
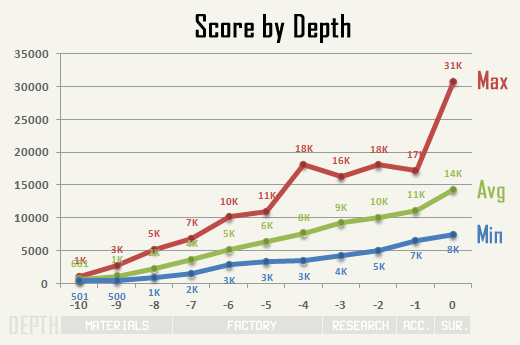
Let’s look at scores from another angle, based on depth reached:
The red Max line represents combat runs, where the point rewards are greater (accompanied by a higher chance of death). Speed runs on the other hand always fall between the Avg and Min line. In fact, players automatically receive 500 points per depth after -10, so the Min line couldn’t get much lower than it is--subtracting 4,500 points (9*500) from that 8K run to the surface, minus the further 2K bonus for the win, leaves only ~1.5K points earned on the entire way up!
Good combat runs will beat out a speed win on points half way through the game, as soon as the difficulty starts to ramp up and the odds of survival go down quickly without superior adaptive tactics. That said, the dynamics of both combat and speed runs will change quite a bit between now and 1.0 when many new maps, routes, and options will have been added. Also, because the world will continue to get wider instead of deeper, depth alone will not be able to tell us as much about progress as it can now.
From the Max spike at -4, one can see that there is plenty of point potential even before reaching the late game, it’s just risky (that player had to have died on -4 to be recorded here, and looking at that record I see they apparently attracted way too much attention but didn’t go down easily and earned a ton of points for it). Farming for points is dangerous lest you suddenly lose valuable parts just before climbing to a new depth and start off in a new area in less than ideal condition.
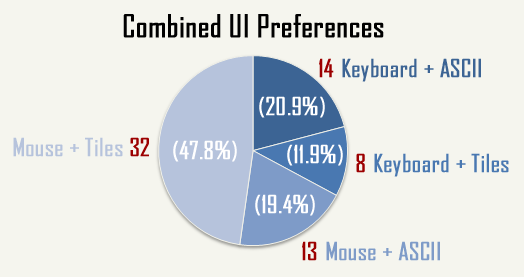
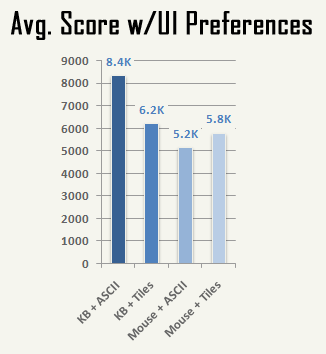
Now it’s time for a little interesting combination analysis, taking multiple UI preferences and checking if there’s any correlation with score. (Okay, we’re not looking to calculate real correlation, just make a fun bar graph…)
First, notice that nearly half of players are using mouse input with the tileset, the most accessible way to play. By comparison, the smallest portion of players combine keyboard mode with tiles, which makes sense since anyone using pure keyboard controls is likely pretty hardcore, and many traditional roguelike players enjoy ASCII. (Of course, this entire graph is only so reliable because not all players have the full range of choices available to them. For example someone may want to go full keyboard but can’t because Cogmind doesn’t currently support alternative international layouts, or they may want to use tiles but their screen is small enough that they need ASCII in order to better parse the map.)
With regard to score, the assumption here would be that pure keyboard users in ASCII mode are the “most hardcore” and therefore more likely to achieve higher scores. This seems to be the case:
Of course there will be exceptions--the #2 ranked player, for example, falls under the largest Mouse + Tiles category, and even if we remove our relative outlier zzxc (30,733 points), the KB + ASCII average is still 7.5K, or an average 31% higher than the other combinations (our second outlier doesn’t belong to the KB + ASCII average so the general shape holds true). All things said, as a display of averages this graph is pretty interesting!
While we’re on the subject, looking at records of all winning players including those outside the tournament, three use Mouse + Tiles, two use Mouse + ASCII, and two use KB + ASCII, so if we use winning as the primary metric rather than score, the UI preferences come closer to simply matching the preference distribution graph (3 : 2 : 2 | 48% : 20% : 20%). That sample size is too small to be meaningful, but it’s fun :D. The current distribution is also impacted by game age: Cogmind is quite young, and some long-time mouse players will eventually tend to transition to keyboard while seeking more efficient means of play, but they haven’t had long enough to do that yet.
Builds
Finally we get down to specific mechanics.
At the core of the game, and the player’s only choice in terms of permanent character development, is how many slots of each type to choose as you evolve. For experienced players looking at the end game these choices are likely driven by a long-term plan, but for others the decision might be influenced by the current situation at the end of a floor, including but not limited to what you happen to be carrying in your inventory =p.
In any case, by the half-way point it’s apparent that utility slots start to outnumber everything else. Power, propulsion, and weapons all have varying degrees of diminishing returns depending on your strategy, while utilities always remain the most flexible, capable of effects ranging from intel and defense to offensive augmentation. Given the mechanics, the optimum slot strategy will always be to evolve as few non-utility slots as you think you need, and pour everything else into utilities. (That doesn’t mean you might not overdo it at some point, wishing you had an extra power/propulsion/weapon slot instead of all those utilities.) You can see this play out in the graph below:
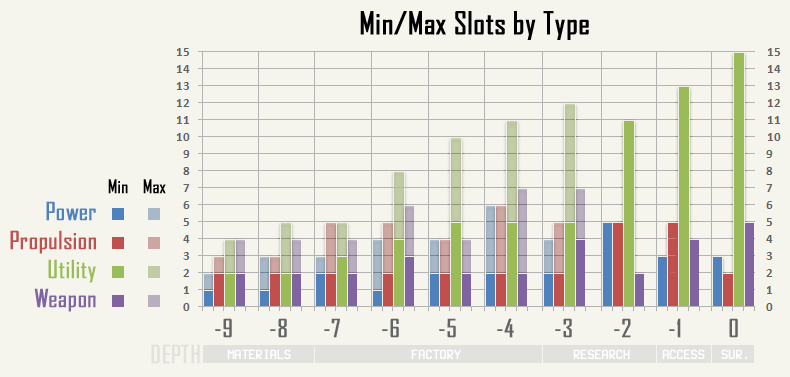
The fewest and most of each slot type on any build destroyed at a given depth (this only takes into account the highest-scoring runs for each player, so by definition it excludes many speed runs and narrows the visible ranges). (Click to view at full size.)
Power slots can vary greatly depending on how much energy your style requires (many of the best utilities are extremely power hungry). Space afforded to propulsion is largely dependent on your preferred form of movement. Similarly, weapon counts are going to be directly proportional to how confrontational you want to be.
A less permanent but equally important aspect of the game, dynamic inventory size (see the full design analysis) can tell us a lot about play style.
The most successful combat builds always end up using a good number of utility slots to expand inventory capacity, particularly suitable for that style of play. (Slow Cogminds getting caught in the wrong place without enough spare parts can, if unlucky, be picked apart pretty easily and end up stripping down to flee.)
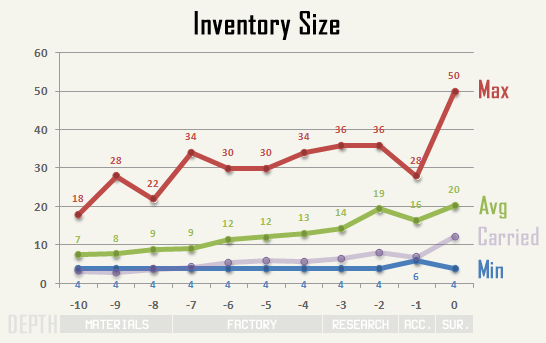
Min/Avg/Max inventory size at each depth, where “Carried” refers to the average number of items held in inventory throughout the game to that point.
The red Max line again represents full combat builds, here carrying multiple Storage Units to have as many spare parts on hand as possible (for reference, a single High-Capacity unit holds 8 parts). The average run contains a more manageable 10-20 spaces (one or two units on top of the base inventory space, 4). And speed runs often get by on much lighter inventory.
Notice the low Carried values! Actually, note that in practice it’s likely a little bit higher than shown here for all depths except 0 because before death Cogminds are known to run around naked while frantically searching for an exit =p. I have noticed, however, that some players do run around with partially empty inventories during normal play, which is a really bad idea and generally unnecessary given all the scrap lying around.
At the high end, carrying 50 items at once is fairly insane and I admit not something I expected when first designing the inventory system. This strategy was pioneered by the first combat winners, though past a certain point you reduce your overall effectiveness by using up too much valuable utility space for storage. Some tweaks will eventually be necessary to put a cap on what is feasible. That and the current inventory UI was optimized for a size of 20 or so, with 10-12 items viewable at once and up to 20 conveniently reachable via sorting commands, so even larger inventories can be tedious to manage. (I have ideas for some adjustments there, if necessary.)
Hacking
Most players do some amount of hacking. If anything a terminal is a source of potentially free information depending on what easier direct hacking targets are available.
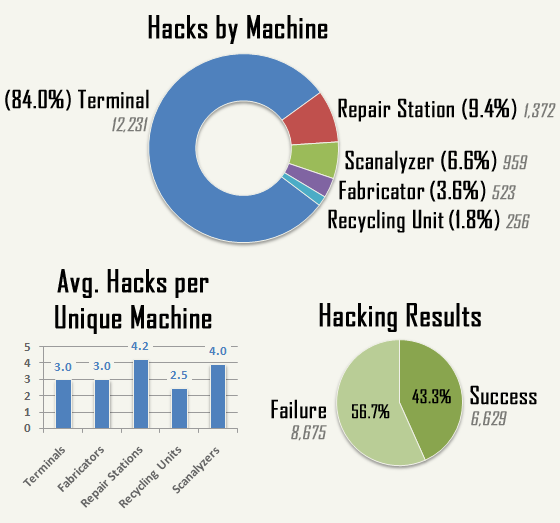
The per-machine data comes as no surprise:
- Terminals (84.0% of all hacks) are by far the most common interactive machine, and offer the widest variety of functionality. I’m guessing most players who pass a terminal will generally tap into it to at least see what’s available.
- Repair Stations (9.4%) are much less common, but make it possible to increase the longevity of vital parts, which is a valuable benefit when you’ve already found something you really want to keep. (Unless it came off a robot, or you can build your own, you’re unlikely to find one again!)
- Scanalyzers (6.6%) are easy to hack so they do get some use, but based on Fabricator access data more than half of the resulting schematics obviously go to waste. I have a couple ideas to increase the usefulness of Scanalyzers, both alone and in combination with Fabricators.
- Fabricators (3.6%) are rare enough that even players who want to use them may not have ample opportunity. The cost-benefit of building parts and robots is only worth it in special cases, though that was the purpose behind the system. Low usage rates can also be attributed to many players having still not learned how to build things.
- Recycling Units (1.8%) aren’t so useful right now since there are better ways to collect matter. This machine will be getting a complete overhaul and become much more valuable later. I anticipate this percentage will rise significantly.
The number of hacks per unique machine seems reasonable. Terminal targets can be hacked with a single command each, but there are more options and terminals usually allow for about three hacks before being traced. Non-terminal machines require at least two hacks to accomplish something (this is because it would otherwise be too easy to bypass security by brute forcing the system over time); this ups the numbers on those machines. (Note this graph doesn’t account for machines that were intentionally skipped by the player, so it in no way reflects the relative popularity of a given machine type, which we already saw in the first graph.)
The Success (43.3%) vs. Failure (56.7%) graph doesn’t really tell us much since we don’t know the difficulty of the attempted hacks, except maybe that players generally stop hacking once they’ve been detected rather than risk a trace.
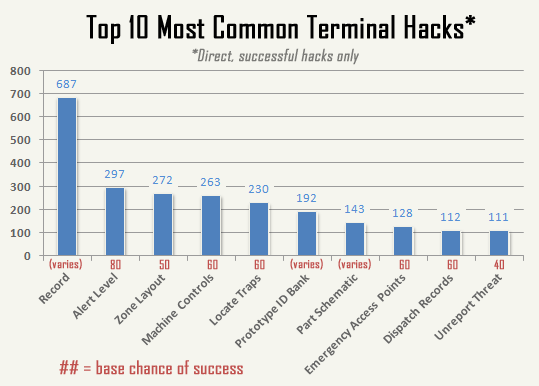
Because the score sheet doesn’t currently tally target-specific failed hacking attempts, this graph is less useful to us for analyzing player behavior as it naturally prioritizes the most common and easiest hacks. What we can see is that players are using these hacks, and in what general ratios. To make the data more meaningful I’ve shown the base difficulty for each target type. For example, Emergency Access Points and Machine Controls both have the same difficulty (50% base chance), but the latter is obviously preferred by more than 2 to 1. (That’s interesting because I’m not sure how well players even understand the effect of sabotage via “Control(Machines),” which is not yet explained anywhere in game.)
Unreport Threat (i.e. “Alert(Purge)”) appears last among the top 10, though my impression is that it’s one of the most sought after targets and I suspect anyone who knows their hacking is also going after that one manually.
There are four other hacks with a 50% base chance to succeed which are not on this graph--Transport Status, Reinforcement Status, Terminal Index and Hauler Manifests--none of which are surprising since the first three aren’t as useful, while the last one is at most useful only once per floor, if that. Maintenance Status is the only high-chance hack (70%) that isn’t on the list but might be if everyone had the same understanding: There are so many maintenance bots running around that getting a snapshot of their locations works as a poor man’s map layout hack (a discovery made by early Cogmind strategist jimmijamjams).
Resistance
As anyone who plays Cogmind becomes aware of before long, the world isn’t just a static place waiting for you to explore it and encounter inhabitants awaiting your arrival. (For more about this, read The Living Dungeon.) Based on the amount of negative “influence” you’re having on the surroundings, the central AI reacts to your presence with what it considers a proportional response in order to contain the damage. This acts as a sort of self-adjusting difficulty level (though handled in a realistic manner), by which players earning higher scores will come up against greater resistance.
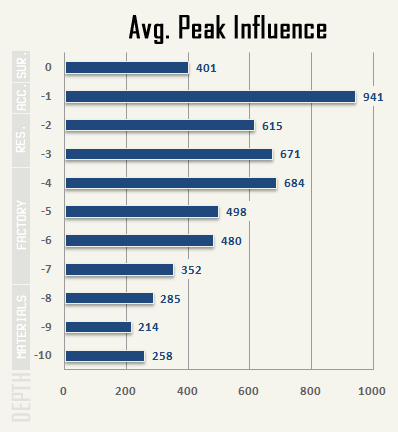
The effect has been toned down somewhat since the earliest versions, to give players a fighting chance in the late game which used to be pretty overwhelming unless you spent all your time in stealth mode. Still, as you can see below it becomes increasingly difficult to keep your influence from rising later in the game:
That said, all the winning builds (arrived at depth 0) were apparently those which were able to keep their influence relatively low throughout the game. Even one of the two combat wins was close to the average value!
Influence directly translates to security level, which is what really determines the hostile response:
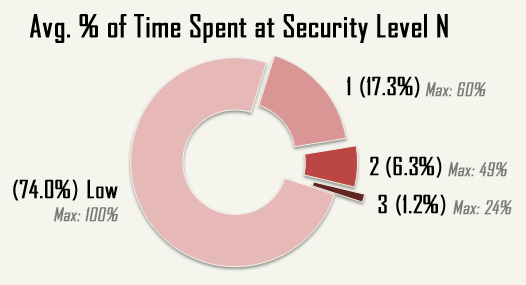
Average amount of time at each security level during all runs, showing also the longest duration (“Max”) reached during an individual run.
There are actually five security levels. A few players made it to #4, but the data was so insignificant that the percentage didn’t register by the end of two weeks, so here we’ve left out both 4 and (oh my you wouldn’t last long) 5. The highest level we’ve got in this graph is someone who apparently spent nearly a quarter (24%) of their game at level 3.
There was a time earlier in Alpha when it was easier to rack up influence with a small army at your side, and players who did that ended up in so much trouble once that army was gone. (The system is more realistic and appropriately balanced now.)
The vast majority of runs (74%) remained at Low Security; of course, as we’ll see further below 54% of runs didn’t make it out of Materials, i.e. the early game, where it’s not so easy to raise your security level very high. From the peak influence graph further above, you can see that after a relatively steady level of influence through Materials the true danger starts in Factory, where influence begins climbing rapidly. This is a side effect of both greater numbers of more dangerous enemies (including the appearance of Programmers) and longer stretches between map transitions (which are a way to lose some heat).
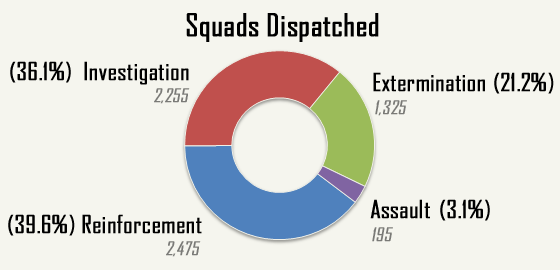
The primary way in which the AI responds to the presence of Cogmind or other hostiles is to dispatch different types of squads depending upon the activity involved. I’m not going to go into detail here because doing so would be somewhat spoilery, but we can talk about the obvious outlier here, Assault squads. Assaults are only dispatched to deal with a significant threat, so even without hacking terminals to check the current security status you know you’re pissing off the AI when this happens. It usually doesn’t take more than a few such squads to squash Cogmind, so we don’t see as many of them because either they stopped a run, or the player was able to keep their influence low enough under the radar that they weren’t dispatched in the first place.
Combat
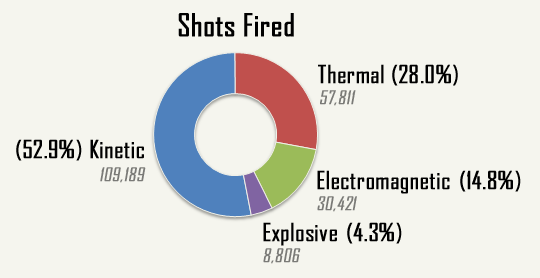
In Cogmind, if you’re not sneaking or running--or possibly hacking--you’re shooting. That means lots of projectiles flying around. Just how many? This many:
The four types of ranged damage each have their own properties, though in terms of player choice this graph must also be taken with a grain of salt because often times players equip themselves with parts salvaged from hostile robots, and robots are most likely to carry kinetic weapons, followed by some thermal, very little electromagnetic, and virtually no explosives.
Still, the general popularity of kinetic is likely above that of the other types, since it doesn’t generate much heat (thermal/EM) or require much matter (explosive). And of course some amount of choice is behind the data because 1) there are certainly plenty of weapon caches and 2) kinetic weapons are actually more rare than thermal weapons in terms of random finds. So there is meaning here, after all.
Just over half the shots fired were kinetic (52.9%), probably the easiest type to use. As the other major category, thermal accounts for nearly a third (28.0%), and could use an additional benefit or two (beyond the recently added offensive meltdown potential), because it is not usually worth simultaneously powering thermal weapons and a range of utilities. By comparison, better energy and heat balance contribute to the stable versatility of kinetic-based builds.
Electromagnetic (14.8%) weapons are somewhat more rare, and only available from a very small number of hostiles, which, combined with their lower damage and reliance on specific side-effects, means they don’t see much use. However, during the tournament it was confirmed that, where possible, complete reliance on EM in the late-game is OP. There will be a few tweaks to this damage type coming up.
Explosives (4.3%) are one of the most valuable and sought after weapons in the game, but at the same time we can see that most players learn pretty quickly to show restraint when they get one because the level of destruction and resource drain are enough to do anyone in. (There are stories of those who don’t show restraint--the path is glorious, but the ending ain’t pretty.)
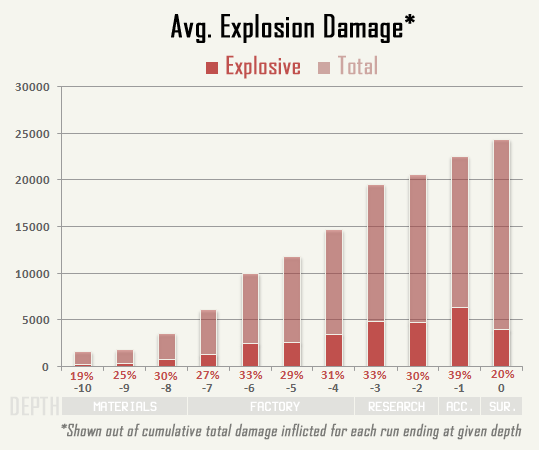
Even assuming restraint, despite only 4.3% of shots being fired from an explosive weapon, an average of 28.7% of all damage inflicted was due to explosions:
The percentage of explosion damage remains fairly steady throughout the depths, with a few understandable exceptions:
- As finding an explosive weapon isn’t absolutely guaranteed, players who died in the first couple depths were less likely to have had one, while those who did find one quite likely made it to -8 or -7. When used correctly an early Grenade Launcher is like an Advance to GO card, where GO is the Factory.
- The low surface value (20%) comes from a majority of victories being stealth runs (i.e. where you don’t go blowing everything up).
In a more general sense, the relatively small 4.3% of shots doing 28.7% of the damage suggests that explosives were being effectively used against groups of hostiles (as one would expect). Certainly they’re more powerful than other weapons, but not nearly 6.7 times as powerful. Actually, from the data (and weapon stats) we can extrapolate that roughly 2.7 robots were hit per explosion.
On the same graph we can also examine the average total damage per depth, which doesn’t offer us anything particularly interesting except that jump at -3. In combination with that, notice that seven of the top ten players (as shown on the earlier high scores list) were stopped in -3, hence this is where they made their last stand against more difficult opponents (and more importantly in a more difficult environment) than in previous depths. An alternative way to read the same data (since we can’t be sure the damage wasn’t inflicted before arriving in -3) is that only players who were more capable of dealing significant damage were able to even reach -3.
So how effective was all this shooting…
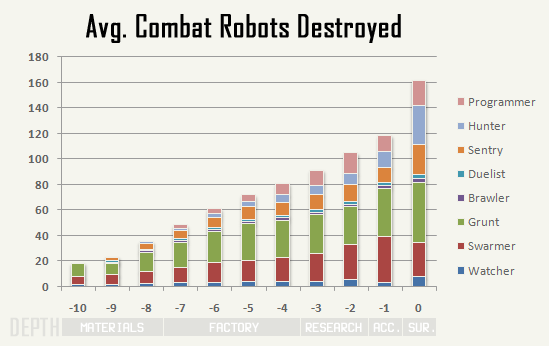
Cumulative average combat robot kill counts during runs ending at each depth (e.g. players destroyed on -4 had on average destroyed about 80 combat robots). Graph includes only the most common combat robot classes.
In terms of total kills, the trend is gradual and clear. Aw yeah.
The noticeable spike at the end is because 1) by then the player can be armed with what are currently the most powerful weapons in the game, which outclass anything the enemy can throw at you there (trust me, they’re holding the fearsome stuff in reserve for more important locations and events to come :P) and 2) players prepared to exit -1 have free reign to use surplus resources to first attract attention and take down as many hostiles as possible before leaving.
Class-wise:
- Grunts and Swarmers are the most common patrol robot, and travel in groups, so they are naturally the most common kill. Duelists and Brawlers are occasionally found accompanying Grunts, and not so often as part of regular patrols, so their numbers are fairly small.
- Sentries guard important intersections so taking some of them out is inevitable, but they always work solo (and can be circumvented), so again fairly small numbers there.
- Programmers don’t start appearing until -7, after which both they and Hunters gradually increase in number.
How do those numbers compare to robots minding their own business:
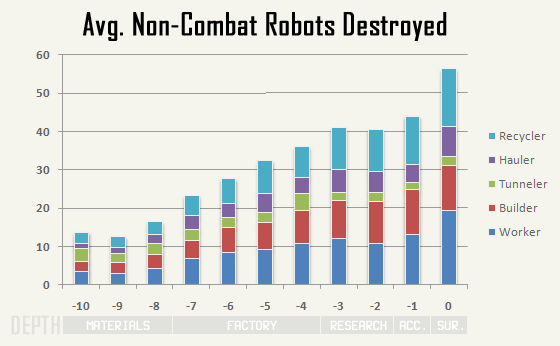
Cumulative average non-combat robot kill counts during runs ending at each depth (e.g. players destroyed on -2 had on average destroyed about 40 non-combat robots). Graph includes only the most common non-combat robot classes.
The total number of non-combat robot kills flattens out through the latter third of the game presumably because you don’t have the luxury of taking them out while worrying about the then much deadlier foes patrolling the corridors of Research and beyond. They also don’t provide much in the way of useful salvage by this point--if you’re looting Wheels or Light Ion Engines there is a good chance you’re soon to be scrap (unless you can remain minimally effective just long enough to locate a real cache).
Class-wise:
- Despite being unarmed, Recyclers are public enemy #1 since they ruthlessly spirit away your hard-earned loot. If some players weren’t already using warning shot tactics to shoo them away, these would certainly also enjoy the top kill spot. Already two pieces of fan art have surfaced about Recyclers (1, 2), together with countless mentions among players in other capacities. They’re (in)famous!
- Haulers are “the piñatas of Cogmind,” though not as plentiful as the other types, so their ratio looks about right.
- Tunnelers are not necessarily the safest of the bunch--they do tend to stay out of the way, but there are also fewer of them to begin with. They’re likely destroyed only when in the way.
- Builders are frequently caught in crossfires as they work to repair combat zones.
- Workers are the most abundant robot, and also roam about fairly slowly, so they are more likely to become an obstacle in a narrow corridor and warrant a shot in the back, as well as be in the wrong place at the wrong time and get blasted by stray shots. Their greater numbers also mean they’re the most readily available target when low on matter or you need a quick power source. I’m not entirely sure where the Worker death spike came from for the last bar, but there are only two players who contributed to that data segment, so it has to do with their particular style (blow the crap out of everything)--it’s also not as huge a difference as it appears, only an extra five or so Workers destroyed.
In short: players hate Recyclers, Haulers are piñatas, Tunnelers are few, Builders get in the way, and Workers are everywhere.
Comparing the previous two graphs, aside from the last couple depths players generally destroyed twice as many combat robots as non-combat robots.
Lots of robots were destroyed, but then most Cogminds didn’t make it out alive, either…
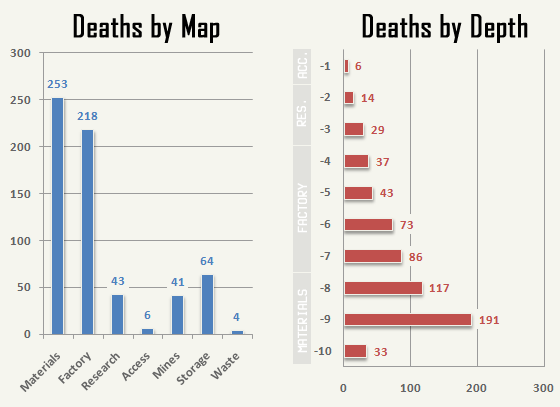
First see that beautiful curve on the right. It’d be really interesting to compare what it looks like after some time with the same set of players--I’ve no doubt the peak would gradually begin to shift upward, but for the duration of the tournament it makes sense as seen here since the overall community experience level was relatively low.
The low death count at -10 can be attributed to most deaths on the first floor not earning enough points to qualify for inclusion. However, without the point boost from evolution those 33 Cogminds that were included must have caused quite a stir.
The steep drop from -9 to -8 occurred because anyone with the ability to beat -9 won’t likely have too much trouble with -8. Similarly, the drop from -6 to -5 is players experienced with the early Factory floors being fairly successful in the Factory at large. Further up, many players who reached the late game had trouble facing down the gateway that is -3, as it’s another jump in difficulty from the Factory.
Overall, 54.2% of deaths occurred in the early game (-10/-9/-8), 38.0% in mid game (-7/-6/-5/-4), and 7.8% in late game (-3/-2/-1).
Another factor contributing to higher death counts in the early game are the branches, which only exist at that point and keep players at a given depth for longer. (Mid/late-game branches have yet to be added, so the same effect could come into play for them later.) This is reflected in the left graph, where you’ll see that a combined 105 players (16.9%) died in Mines and Storage (early branches).
How did players fare before death:
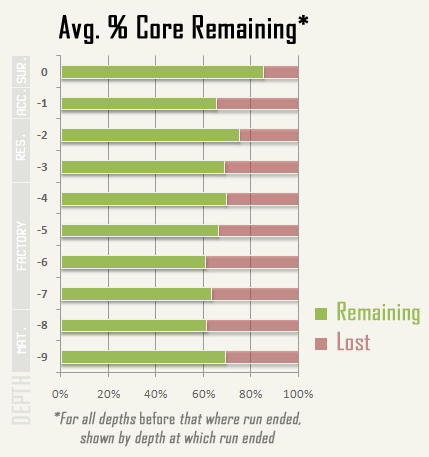
The above graph, showing approximately how much core integrity Cogmind had left on each floor that was survived, is heavily impacted by the lack of historical run data, as the only way to get these values is to calculate backwards from the point of death and average the remaining integrity out over all previous depths. It would be far more meaningful to look at data from individual runs, especially if we stored the necessary values explicitly (plotting that data from all players as overlapping line graphs would be pretty awesome).
But perhaps there is meaning in at least explaining why this graph doesn’t tell us much.
From an individual run’s point of view, as an average it smooths out factors like a lucky exit find that let Cogmind advance relatively unscathed, or the all too common narrow escapes. I’ve made it to an access point with less than 0.1% of integrity remaining, and heard stories of others doing the same. It’s intense.
By averaging all runs together, it also merges the very different data resulting from play styles on complete opposite sides of the spectrum. Combat builds are much more likely to reach an exit with less than half their integrity (remember that in Cogmind core integrity damage is irreparable--you must ascend to the next depth to evolve), while stealth/speed runs don’t have much trouble ascending with 80-90% (it’s an all-or-nothing approach)
Maybe in its current form this data would be somewhat more telling if, again, we compare it to the same set of players later on. At least we could look to see if the 60-70% range has shifted towards 100% with improved skill. The shift would be a slow one, since it’s inevitable that combat builds will lose a portion of their integrity to attrition. The addition of more branches at each depth will also shift the range back towards 0%. That will be something to watch closely :)
Among the factors contributing to death irrespective of core integrity:
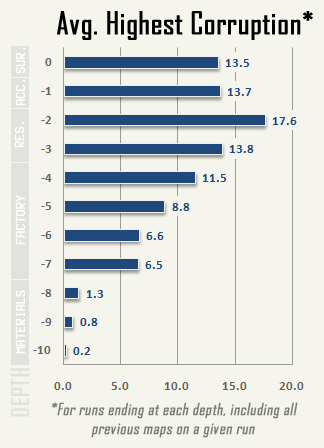
System corruption is one of the game’s food clocks (described in more detail in The Importance of Roguelike Food Clocks). A lack of core repair is the other, which plays a bigger role while Cogmind is weaker in the first half of the game. Corruption doesn’t take over as a serious threat until Programmers start showing up in -7 (see the 400% jump from -8). After that it’s a gradual rise as Programmers become more common and carry more powerful EM weapons, then it plateaus for the late-game stretch. The spike at -2 is players new to the late game getting in over their heads and dying as they get deeper into Research (-2 is probably the most difficult floor in the current version, by the way).
As with other data, there is a large difference between play styles, and these values lie somewhere in the middle ground. By the end of the game, combat builds can peak at 30%+ corruption, while stealth runs can race through the entire game close to zero (they don’t need a food clock--for them the real danger is getting caught in a trap, or chased down by Swarmers, and picked to pieces).
Worth noting, before encountering Programmers (in Materials), those low corruption records are either someone not being careful with their EMP Blaster (self-inflicted corruption), or hanging out too close to an exploding Neutrino Reactor. Don’t do that.
More?
Putting this together (both the event and the statistics) was a ridiculous amount of work so it’s not going to happen again anytime soon. That said, at least the groundwork has been laid to reduce the effort required to simply look at and compare data--the game can now output all these graphs for me :). Later on where tweaks are made we can reload some of these same graphs with data from future versions and see what has changed.
Thanks again to everyone who participated!


10 Comments
Hi,
I am thoroughly impressed by how you ran the tournament and how articulate you are with your data analysis. I kinda regret that I wasn’t a bit more active during the tournament. Are you planning on hosting another one anytime soon? (Also, got to -2 the other day with a speedy cogmind before getting run over by behemoths, hunters and programmers. Speed builds are insane.)
Thanks, I try to give it my all :)
While the tournament was great fun, especially now with a more manageable community size, I can’t imagine something like this being nearly as fun with a broader player base (like on Steam) where cheating would likely skyrocket and become much more difficult to manage.
Before that point, perhaps similar events on a smaller scale would be appropriate to celebrate every few major releases. I do already have the code to output player performance to html, and it would be good to get more feedback and discussion as Cogmind continues to evolve. I really need to focus more on development for now, so we’ll see.
In the meantime, though it’s not the same thing we also have our seed runs. There’s also the leaderboards that get updated once per day. About your speed run, perhaps it would be interesting to modify the board to show both the highest scoring run per player, as well as the furthest run for each player.
“I really need to focus more on development for now, so we’ll see.”
I totally understand :D. I hope you do really well once you get on Steam.
I do have a feature request though, a fairly low priority one. Would it be possible to view item stats in the gallery menu? I don’t do a lot of analysis when I am actually playing and tend to theory craft offline. Having some way to view item stats within the game can be handy. It is not very important but would be nice to have.
Yep, that feature’s on the low priority list already. I can’t even regularly get to everything on the medium-priority list, so it could be a while =p. But I just moved it up a little higher since there have now been multiple requests and I can see its benefit for learning.
The wiki is an okay (and still improving) substitute, but doesn’t really work unless you’ve already explored everything the game has to offer (no one has) since it contains spoilers.
I hope I do really well, too, for all our sakes… Well == MORE! :)
Looking at the rules again, I think you erased four of my runs for being insufficiently scoring. Turns out trying to rush a round of Cogmind in an evening results in a lot of really embarrassing deaths. :P
Small point of order regarding corruption: Equipping faulty prototypes will inflict it too, so it’s not exclusively EM explosions on those early floors.
Also, even the 5% corruption a prototype will give you is crippling enough that it’s a get-out-now incentive, so you probably won’t hang around long enough to get much more… which would help explain why it’s low, and will generally stay low until someone shows up to force-feed it to you. :)
True there are a number of other sources of corruption, that being a kinda of “go to” effect for bad stuff happening to the player :). Another example is being fully traced at an interactive machine, though that one was small and rare enough that I didn’t bother to mention it.
There aren’t a whole lot of prototypes that early, but I did forget that one since it’s only one possible side effect rather than a certainty (and the value is +2-5%, by the way).
Then I’ve merely been unlucky, because I don’t remember it ever being less than 5%.
Then again, perhaps I never noticed the smaller ones. (What am I saying, even 1% corruption is a pain in the ass…)
Haha, I’ve heard some players who would agree with you about it being annoying as soon as you have that first 1% :). I pretty much ignore it until it starts rising over 15~20, which takes a while.
You’re kidding, surely. How do you not go insane with constantly disabling guns, shooting at random and losing your parts?
I mean, it’s not that it’s mechanically crippling, it’s that crossing a level to the exit starts to involve three or four ‘pause for a second and get things set up again with a couple more mouse clicks’… and on at least one occasion I somehow didn’t notice, and drove out of the level leaving my Centrium Treads behind, at Overweight x4. :P
Haha, you left those behind?!
Last version I added 500ms of move blocking when you have a part rejection, but that’s apparently not quite enough like it is for robot/trap collision since the latter has an accompanying visible warning too (and alarm sfx). In the next version I’m increasing the rejection-movement blocking timer, and also adding a warning sound to make it extra obvious.
For me I use the keyboard, so reacting to stuff like corruption effects is quicker.
Another change to come: Your weapons will be properly restored to their original configuration after a misfire :)